KarminaAI StudioAgents · Services · Training





Performance & Intelligence · AGENT-A06
Dashboard Builder
This landing page explains what automates Dashboard Builder, what sources and tools you need, how the result is reviewed and how it can be applied within a company.
StrategyOwn knowledgeProportional permissionsHuman supervisionMeasurement and improvement
01
The agent, at a glance
What Accelerates
The collection and standardization of data, the updating of tables and visuals, quality controls, the preparation of comments and the recurring distribution.
What does it deliver
Dashboard, report or data package with defined metrics, comparable periods, incidences, sources, update date and reviewable narrative reading.
For whom it is
Marketing teams, management, projects, sales, communication, performance or operations with recurring reporting and scattered sources.
What it doesn't do
It does not fix poor quality data without leaving a trace, does not invent missing values, does not decide which metric matters without context, and does not present historical data as if they were live.
02
The problem it solves
The same indicator cannot change meaning according to sheet or meeting
The reporting usually fails before the chart. Sources are updated at different times, teams use their own formulas, and comments are prepared without knowing if the data is comparable.
The most common frictions are:
- Copy and paste information each period.
- Hidden or different formulas for the same KPI.
- Duplicate data, incomplete or with delays.
- Dashboards that no one knows how to keep.
- Conclusions that do not distinguish fact, hypothesis and recommendation.
- Reports that accumulate metrics without answering questions.
- Different versions circulating at the same time.
The Dashboard Builder converts the reporting into a governed process, not an automatic template.
03
What exactly is Dashboard Builder?
It is an agent that reads structured sources, applies documented transformations and controls and updates a view designed for specific people and decisions.
You can build a new dashboard or automate part of an existing process. In both cases, the first important deliverable is the data dictionary: what each field means, where it comes from, how it is calculated, how often it is updated and who is responsible for it.
04
What do you do, specifically?
01. Invent the Sources
Identify systems, sheets, exports, managers, frequencies and dependencies.
02. Standardize metrics and dimensions
Apply names, formulas, formats, time zones, currencies, channels and agreed periods.
03. Check the quality
Detects missing, duplicated values, jumps, schema changes, incomplete dates, and differences between sources.
04. Update visuals and tables
Generates or maintains components linked to specific questions, with hierarchy and accessibility.
05. Prepare a narrative reading
It summarizes changes, points out what needs context, and separates confirmed data, hypotheses, and recommendations.
06. Manage versions and distribution
Publish or share the result on the agreed site, preserve dates and prevent an incomplete version from looking definitive.
07. Document changes
When a source, formula or definition changes, it records the impact and avoids comparing incompatible periods without warning.
DUBTE BACK
You don’t have to know which agent you need.
Let’s start with a repeated task, the sources available and the result you want to review. In a free video call we can assess if you need an agent, a service or simply better order the process.
Video call · free · no obligationBook a free video call ↗A short conversation to understand your starting point and bring clarity.
05
How it works from start to finish
- Check availability and date of sources.
- Extract only the necessary fields.
- Apply cleaning and documented transformations.
- Run controls and stop the process if a critical data fails.
- Update dashboard or report.
- Prepare incidents and narrative reading.
- The owner validates the result.
- The version is published and the trace is preserved.
06
Example of situation
Two sources show different conversions and the system does not hide the discrepancy
The monthly dashboard receives data from the advertising platform and the CRM. The first sample 420 conversions and the second 361 records accepted. Instead of choosing a figure, the agent presents the two with their definition, indicates the difference and checks if there is latency, deduplication or commercial filters.
The team validates that they are different metrics and updates the dictionary. From that point on, the report stops talking about “conversions” generically and shows each indicator with the correct name and usage.
07
What do we need before we launch it?
Essential
- Questions that the dashboard has to answer.
- Sources, fields and periods.
- Dictionary of Metrics and Formulas.
- Responsible and update frequencies.
- Quality rules and tolerances.
- Publics, permissions and distribution channel.
- The difference between provisional and validated data.
Highly recommended
- Examples of current reports.
- History of source or methodology changes.
- Objectives and interpretable thresholds.
- Visual and accessibility conventions.
- reporting Incident Record.
08
How we implant it
- Diagnosis of questions, sources and consumers.
- Design of the data model and dictionary.
- Prototype with a real sample.
- Quality controls and comparison with manual process.
- Visual, functional and permission validation.
- Onboarding from the owners and readers.
- Progressive automation of update and distribution.
A REAL TASK IS THE BEST BRIEF
Explain where the friction is concentrated.
You can send us an example, the approximate volume and how it is reviewed today. No need to share sensitive data to make a first assessment.
09
Human supervision and boundaries
The agent can
- Extract, clean and transform data according to rules.
- Update visuals.
- Detect inconsistencies.
- Prepare comments and alerts.
- Distribute a version validated or marked as provisional.
Agent can't
- Invent values or silently fill absences.
- Change formulas without registration and approval.
- Give for comparable periods that are not.
- Exposing data to people without permission.
- Turning a correlation into a causal conclusion.
Stop and scale when
A critical source fails, the scheme changes, a metric out of tolerance, the totals do not reconcile, there is sensitive data or the version cannot be identified as provisional.
10
Sources and possible connections
Marketing platforms, analytics, CRM, ERP, spreadsheets, project management systems and repositories. You can get alerts from theAds Monitor, feed the Karmina Review AgentGive context to Project Pulse and prepare data for a Client Update.
11
How do we measure if it adds value?
- Update and preparation time of the reporting.
- Percentage of executions without quality incidents.
- Differences detected before distribution.
- Number of defined metrics and owner.
- Reduction of contradictory versions.
- Real use of dashboard by recipients.
- Time between an anomaly and your understanding.
12
For whom does it make sense?
It can fit if
- The reporting is recurrent and manual.
- There are several sources or teams.
- The definitions of KPI generate discussion.
- dashboards exist but are not reliable or maintainable.
- You want to combine visualisation with a narrative reading.
It’s not the first step yet.
- It is not known what questions need to be answered.
- The sources are not available or are not responsible.
- You want a real-time appearance with data that is only updated manually.
- The main problem is the quality of the origin process.
DUBTE BACK
You don’t have to know which agent you need.
Let’s start with a repeated task, the sources available and the result you want to review. In a free video call we can assess if you need an agent, a service or simply better order the process.
Video call · free · no obligationBook a free video call ↗A short conversation to understand your starting point and bring clarity.
13
Knowledge Foundation and adoption
The knowledge base includes goals, metrics, formulas, fields, sources, frequencies, permissions, and interpretation criteria. This layer should be read by both the agent and the people using the dashboard.
The onboarding teaches you to distinguish a data from its interpretation, review alerts, update definitions, and maintain confidence when a source changes.
14
Frequently Asked Questions
Can I create a dashboard from scratch?
Yes, as long as questions, data and public are defined before. Design doesn’t start with graphics.
Do you work in real time?
Only if the sources allow it. Frequency and latency are displayed visibly; no old data is presented as direct.
Can you prepare reports in PowerPoint or document?
Yeah. The result can be a dashboard, a sheet, a presentation, a document or a combination, depending on the circuit.
What happens if two sources don't match?
Discrepancy is displayed, documented and sent for validation. It is not resolved with an average or an arbitrary choice.
Can you send the report to the client?
You can prepare and distribute it if there is an approval or an expressly authorized automatic circuit. The version and the state must be unambiguous.
How much does it cost and how long does it take?
It depends on the sources, transformations, visuals, frequency and permissions. It starts with the most important questions and a verifiable data set.
15
Closure and conversion
What part of the reporting still depends on a person who copies, checks and re-explains?
Share with us a report, its sources and the questions you should answer. We will assess what can be automated and what needs a shared definition first.
Direct contact hello@karmina.ai
Karmina, the agency behind the Studio
Why Karmina?
Behind Karmina AI Studio there is an agency with track record, team, scale and applied experience in real organizations.
Karmina · AI Studio · Criterio · Dunder Mifflin · Utopiq · Smart Team
 +€119mIn advertising investment for clients
Ads Platforms
Partners MetaGoogle Ads
 TikTok
 Pinterest
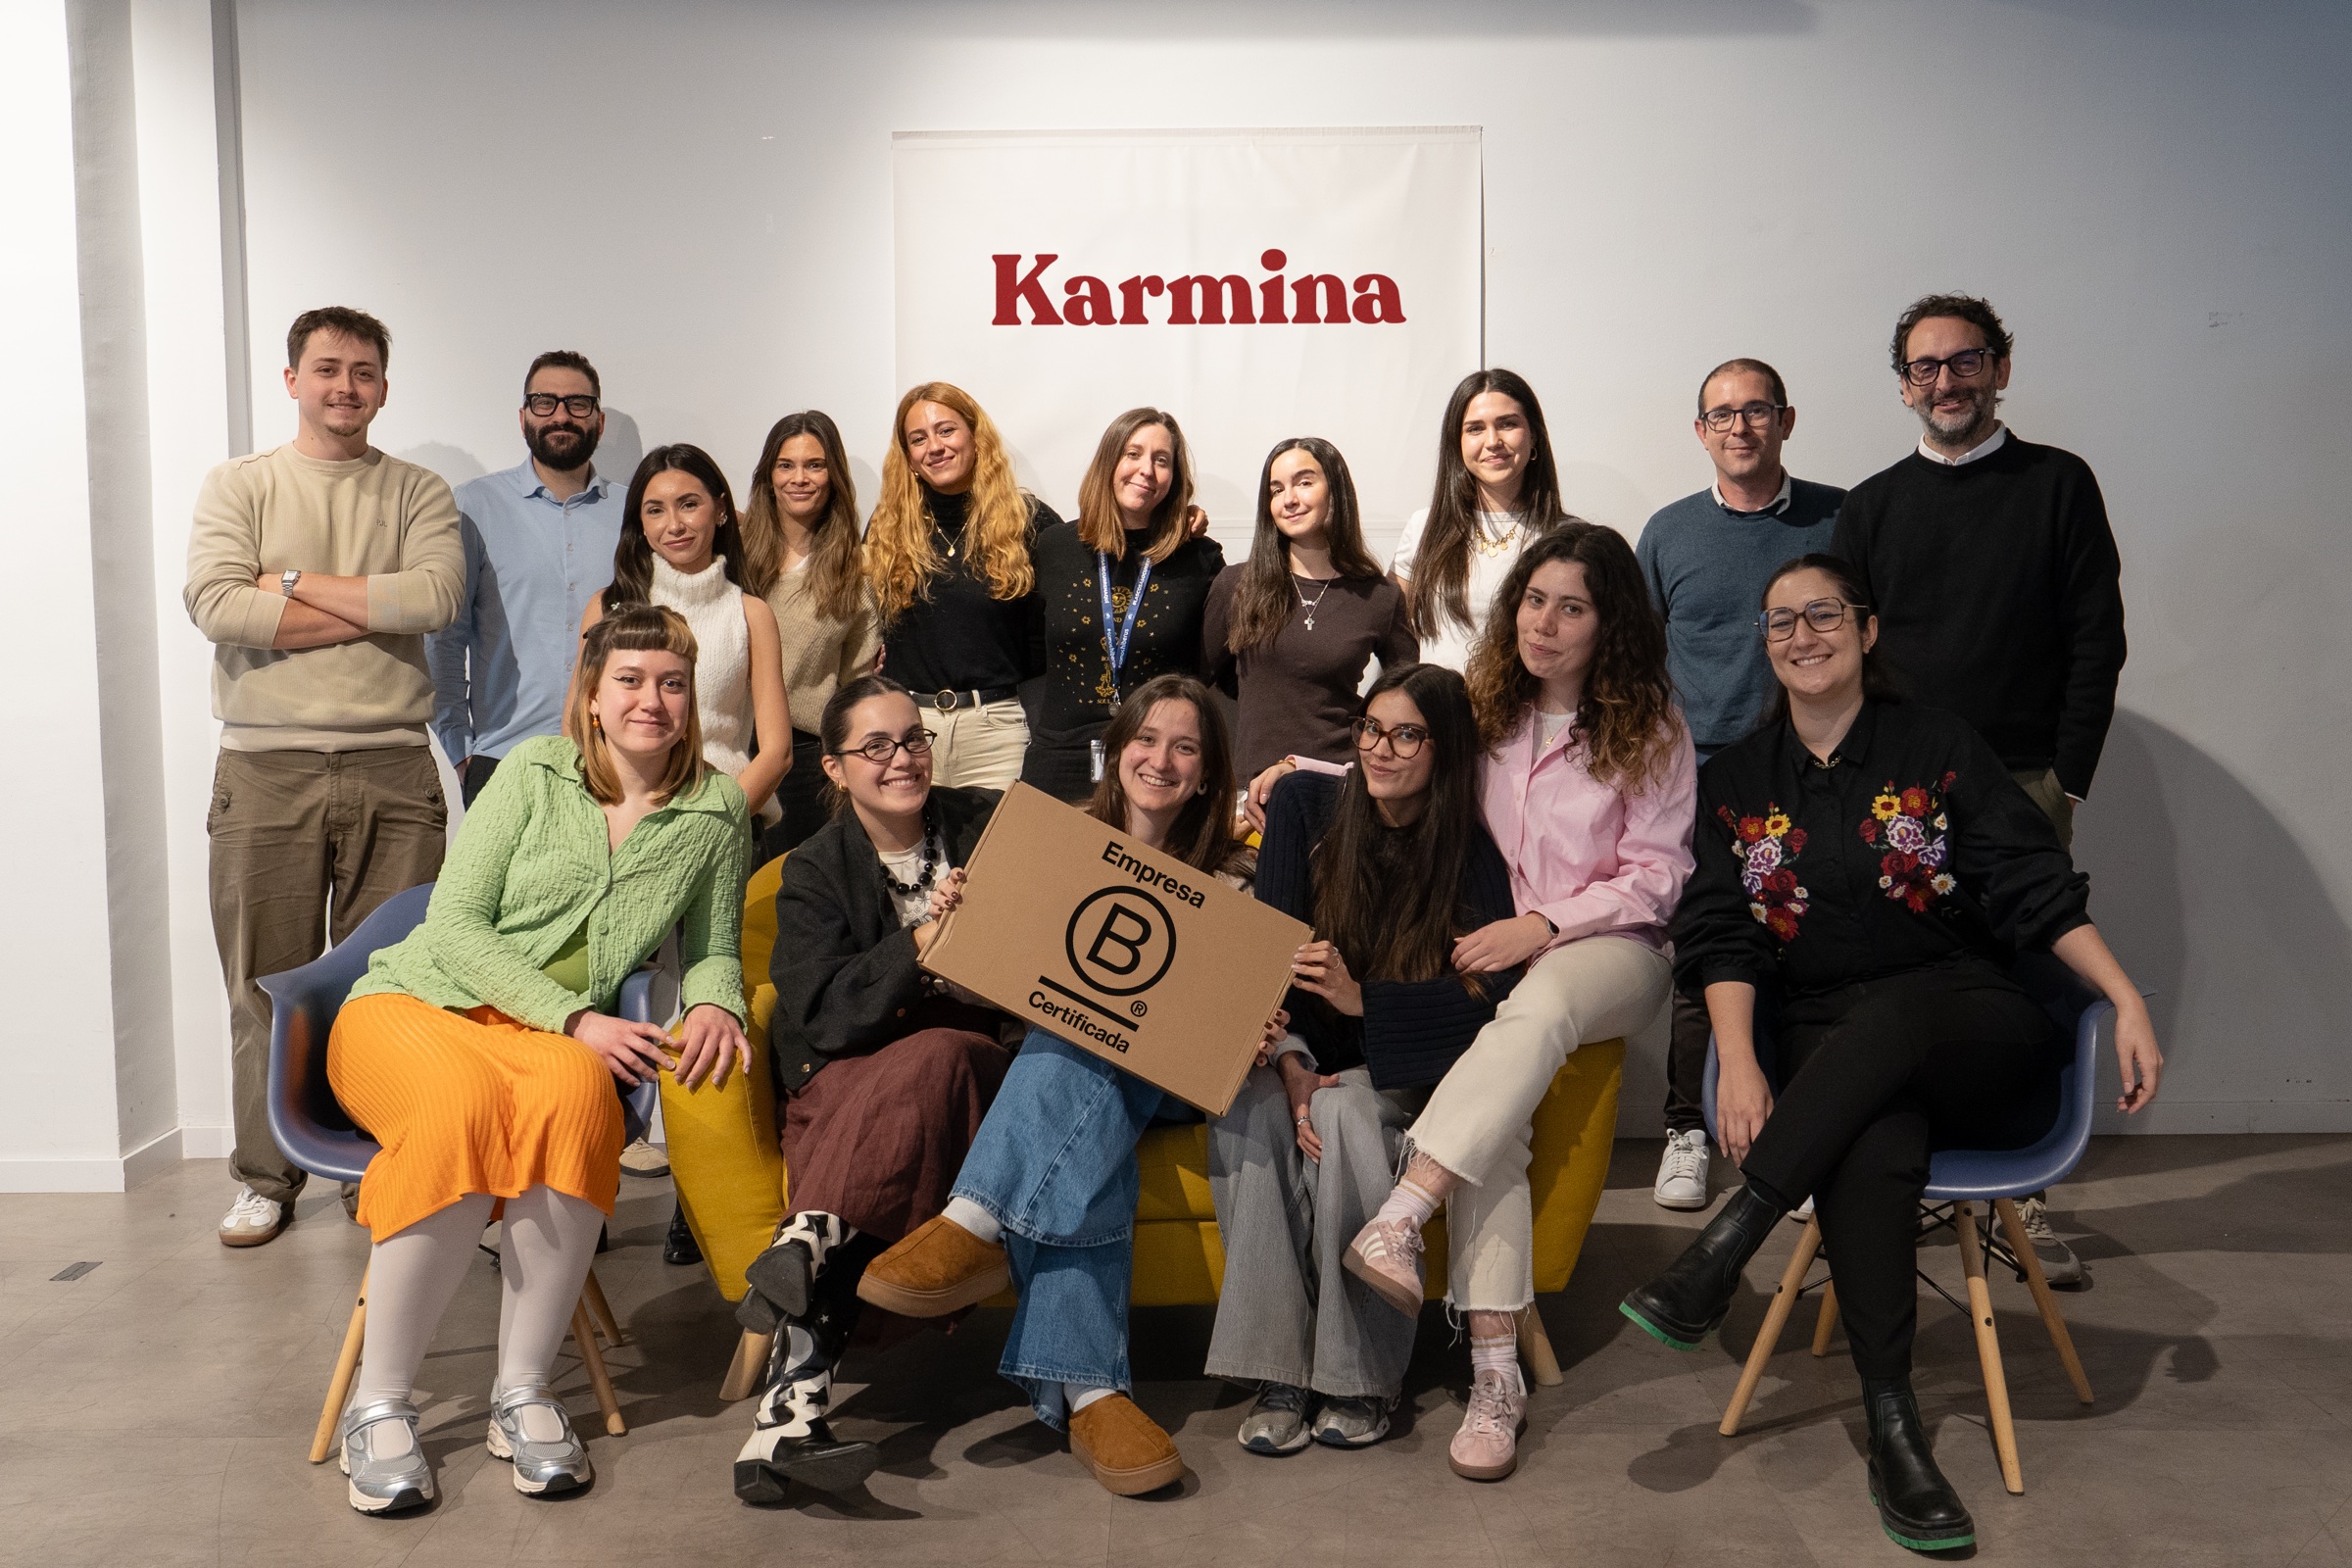 Barcelona
Madrid
Buenos AiresOur offices · Meet the team ↗
+50 KCommunity
 B CorpCertified company
The team
People who connect knowledge and practice


Arnau Sanz
Agentic Strategy & AI Transformation Lead

Ignasi Llorente
AI Partnerships & Business Director

Martina Díaz
AI Finance & Business Intelligence Director

Daniel Mallén
AI Operations & Workflow Lead

Eva Trigo
Generative Creative Director

Ariadna Miranda
AI Administration & Knowledge Operations Lead

Claudia Gonzalez
AI Client Success Manager

Jonan Basterra
AI Social Strategy Director

Laura Sabio
Agentic Social Media Lead

Agustina Córdoba
Content AI Specialist

Alba Gómez
Social Listening Specialist

Paola Cudeiro
AI Client Success Specialist

Roger López
AI Project & Workflow Specialist

Mar Berzal
AI Content Strategy Lead

Andrea Gallego
Community Intelligence Specialist

Candela de la Fuente
Content AI Specialist

Blanca Gómez
AI Community Operations Specialist

Cintia Armajach
Content AI SpecialistLet’s talk
Let's talk about Dashboard Builder
Tell us about your situation, even if the challenge is not fully defined. A member of our team will respond to understand the process and discuss a first step.
hello@karmina.ai