




Recurring Collection
Each report starts by exporting, copying and correcting data that was already prepared the previous month.
SERVICES · DATA AND DECISION
We convert scattered sources, contradictory metrics and recurring reports into a data system that explains what happens, what needs attention and who needs to decide.
Sources · Definitions · Dashboards · Decisions
A selection of routes. The same knowledge base, criteria and people.
IN A SCREEN
Analytics is the service that connects sources, definitions, controls and visualization so that a dashboard ceases to be a showcase of metrics and becomes a decision tool.
WHAT THE SERVICE IS
Campaigns, networks, web, CRM, sales, projects and budgets can describe different realities. When each team calculates periods and indicators in its own way, automating the reporting accelerates the contradiction.
The main work happens before the dashboard: agreeing definitions, documenting transformations, assigning responsibility and deciding what change deserves an alert or a conversation.
START POINT
If you recognize yourself in more than one of these signals, the first step is not to add more technology. It is to build a shared reading of the problem.
Each report starts by exporting, copying and correcting data that was already prepared the previous month.
Two platforms or teams use the same label, but not the same calculation, period or scope.
There are many charts and little context about what has changed, why it might have happened and what needs to be reviewed.
Notices have no proportional thresholds, accountability, or a defined action after notification.
A figure has been transformed, estimated or corrected, but the system does not let you know where it comes from.
The decisions of the month do not update definitions, hypotheses, objectives or the reading of the next cycle.
COMPANY BRAIN · ADAPTED TO THE SERVICE
A useful corporate memory doesn’t just hold documents. It also knows what data change, how often, who validates them and what decision they must feed.
Platforms, CRM, web, sales, projects, budgets and other systems necessary for the question.
→Definition, formula, period, unit, scope, frequency, owner and limitations of each indicator.
→Duplicates, absences, estimates, transformations and data still pending validation.
→Each view adapts to a decision and shows context, not just accumulation of metrics.
→The system preserves what was interpreted, what was done and what needs to be compared to the next cycle.
Technology contrasts. Knowledge is oriented. People decide.
BEFORE YOU CLOSE ABAST
We can review the challenge, starting point and priorities in a free video call. Putting order before writing the scope usually saves time and budget.
ABAST MODULAR
We can start with a single recurring decision and the minimal sources to explain it. When the first reading is reliable, the system grows by blocks.
We identify which decisions should be fed, who uses each report and where frictions or contradictions occur.
We agree what each indicator means and document formula, period, scope, quality, frequency and responsible.
We connect only the necessary sources and maintain separation, permissions and tracing according to the sensitivity of the information.
We design views for a decision, with hierarchy, context, comparison and notices that indicate what needs to be reviewed.
The AI can summarize patterns, compare periods and prepare hypotheses, always showing limits and without converting correlations into causes.
HOW WE WORK
We select a recurring question, reconstruct its trace and check the first version against previous reports before expanding channels or automations.
Scroll to follow the route →We agree on what the team needs to understand, how often, and what they will do when the signal changes.
· brief decision outputWe identify systems, fields, periods, accesses, exports, owners and limitations.
Exit · data mapWe resolve discrepancies and document calculations, transformations, frequency, quality and accountability.
· Output Ruled MetricsWe automate the necessary collection with proportional permissions and sufficient registrations.
Exit · first versionContrast the result with previous reports and with people who know the context.
Output · QA and settingsWe define alerts, reports, responsibilities and how each decision will update the system.
Exit · recurring operationWHAT THE ORGANIZATION CAN RECEIVE
FORMATS
Not all organizations need to get to the same place. We define a phase that leaves a useful decision or asset for itself.
To understand the sources, resolve discrepancies and leave a common foundation before viewing.
Result · map and definitionsTo connect priority sources with views, controls, alerts and a recurring reading.
Result · dashboard validatedTo add comparisons, summaries, hypotheses and learning with AI on an already governed basis.
Result · decision cycleKarmina, the agency behind the Studio
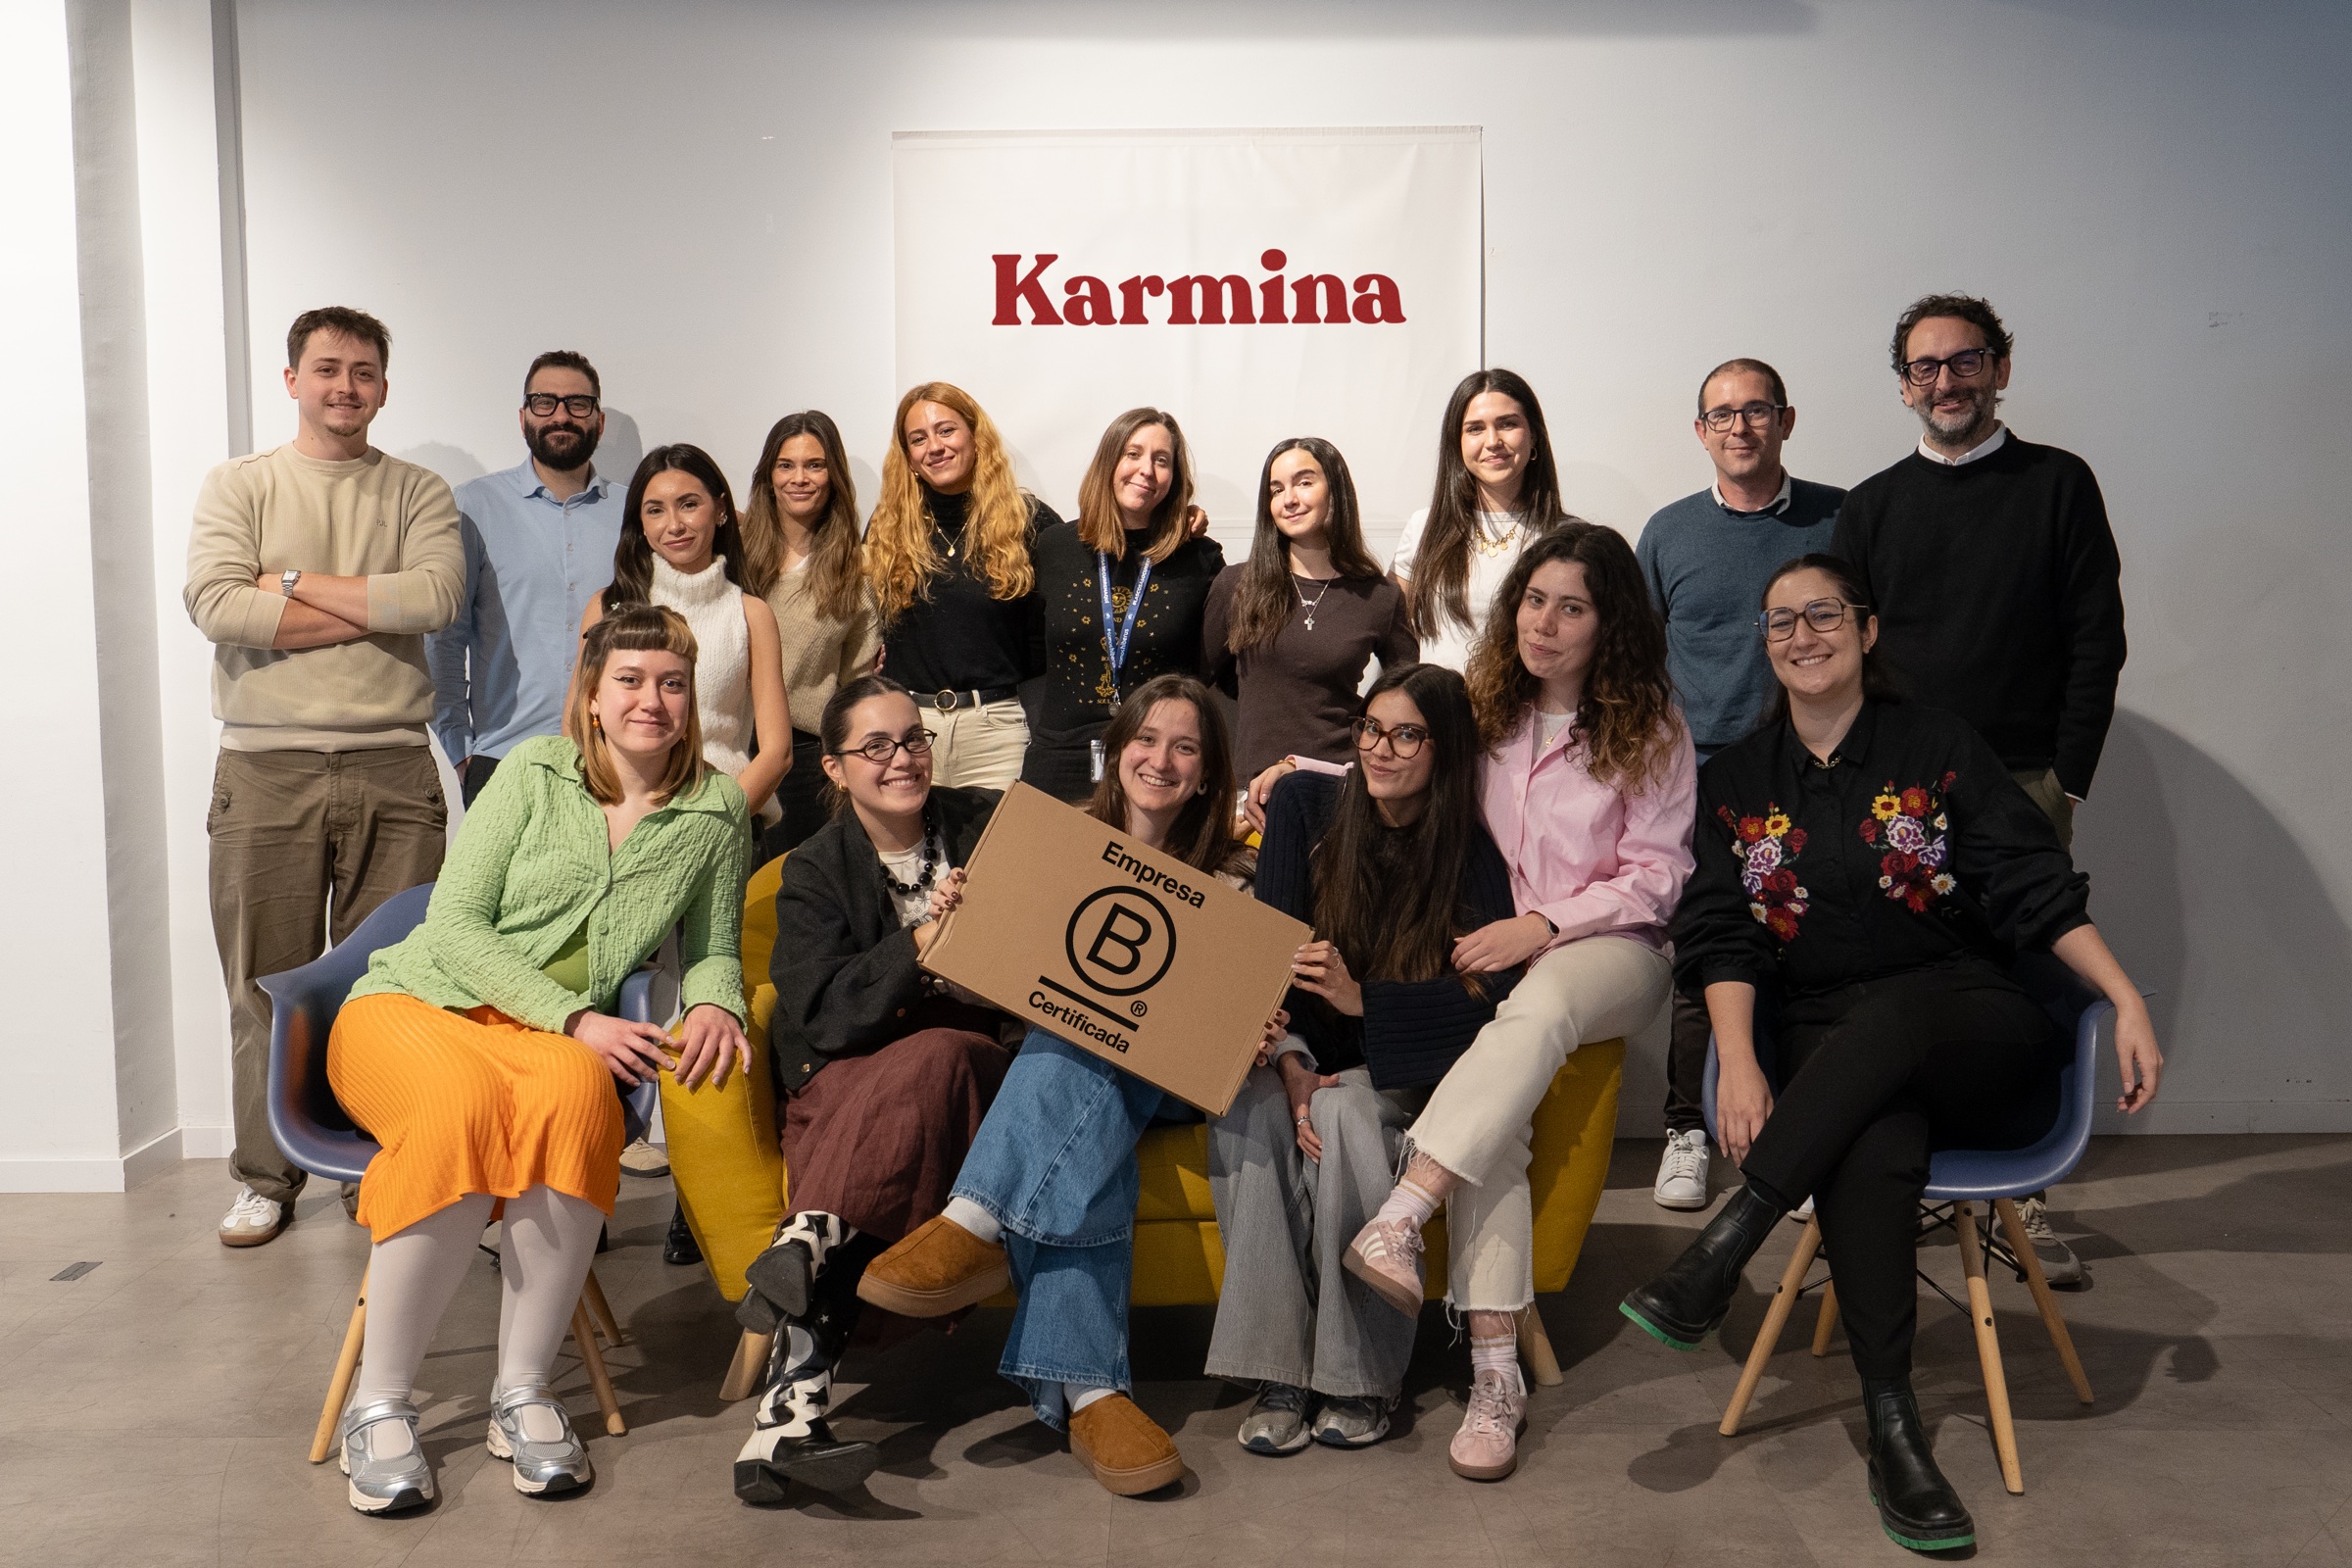
Behind Karmina AI Studio there is an agency with track record, team, scale and applied experience in real organizations.
Karmina · AI Studio · Criterio · Dunder Mifflin · Utopiq · Smart Team
 +€119mIn advertising investment for clients
Ads Platforms
Partners MetaGoogle Ads
 TikTok
 Pinterest
 Barcelona
 B CorpCertified company
IF YOU ALREADY HAVE MATERIAL
It can be a finished document, a few notes or an email with context. We will read it before proposing a conversation or a first step.
Success stories · From 2015
Public administration · LLM Strategy

Public infrastructure · Social Media OS + Agents

Nonprofits · Training + adoption AI

Consumo · Social Publisher

Editorial · Knowledge Guide

Public administration · Meeting Notes

Food and drinks · Benchmark Scout

Restoration · WhatsApp Desk

Beauty · Landing Builder

Food · Dashboard Builder

Retail and Fashion · Market Scout
Move horizontally to see more cases
The team


Arnau Sanz
Agentic Strategy & AI Transformation Lead

Ignasi Llorente
AI Partnerships & Business Director

Martina Díaz
AI Finance & Business Intelligence Director

Daniel Mallén
AI Operations & Workflow Lead

Eva Trigo
Generative Creative Director

Ariadna Miranda
AI Administration & Knowledge Operations Lead

Claudia Gonzalez
AI Client Success Manager

Jonan Basterra
AI Social Strategy Director

Laura Sabio
Agentic Social Media Lead

Agustina Córdoba
Content AI Specialist

Alba Gómez
Social Listening Specialist

Paola Cudeiro
AI Client Success Specialist

Roger López
AI Project & Workflow Specialist

Mar Berzal
AI Content Strategy Lead

Andrea Gallego
Community Intelligence Specialist

Candela de la Fuente
Content AI Specialist

Blanca Gómez
AI Community Operations Specialist

Cintia Armajach
Content AI SpecialistFREQUENTLY ASKED QUESTIONS
No. Most projects are based on existing sheets, platforms and systems. We decide what can be preserved, connected or simplified before proposing a new layer.
We evaluate it according to access, quality, safety, need and maintenance cost. Connecting a source is not a goal in itself; it must help answer a specific question.
It can compare periods, detect changes, summarize patterns, and prepare hypotheses or first drafts. People continue to validate context, causes, decisions, and exceptions.
We apply minimum purpose and permissions. If a data is not necessary for the decision, it should not enter the analytical or generative layer. The specific scope is validated with those responsible for the organization.
Yeah. It is often the best option: select a recurring decision, build a reliable first version and expand only when the team already uses it and can maintain it.
Let's talk about Analytics
You don’t have to come up with a defined architecture. Tell us which report, dashboard or data process concentrates more time, contradictions or doubts, and we will delimit the minimum sources to start.
hello@karmina.ai